This section describes the basic usage of DncGraph.
For details on how to place components on the form and how to set properties, please see How to Use DAQ-DNC.
■When linking with DncDaq
・In the DncDaq input task, it is possible to display the DncDaq data as a graph when the data linkage target is DncGraph.
・In DncDaq, please set the device for data acquisition, acquisition method/timing, and the number of channels for which you want to display data.
・After setting DncDaq, please execute Use task setting in DncGraph.
For the detailed setting method, please see Analog Sampling Sample (Graph Linkage).
■When using the method
・It is possible to display the data using the DisplayData method.
・In the DisplayData method, int type and float type can be specified in a one-dimensional array or a two-dimensional array.
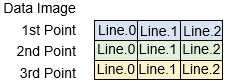
・As an image of the data, please set as many data points as the number of lines you want to display as shown below.
■One-dimensional array
■Two-dimensional array
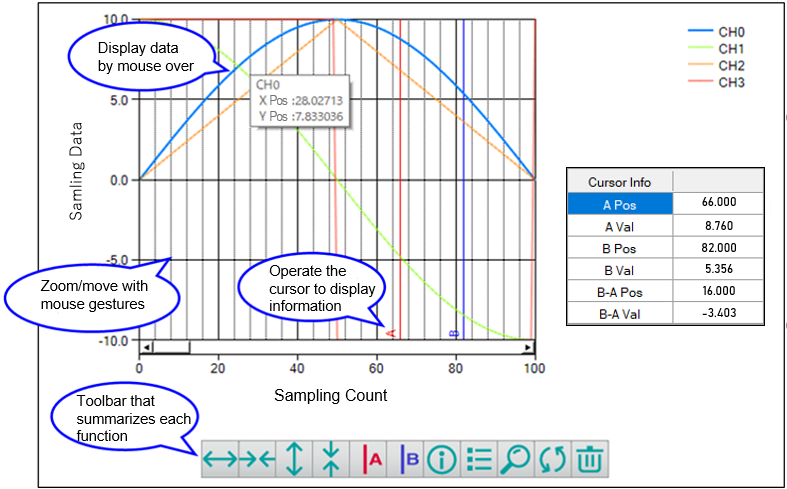
・With DncDaq, you can zoom with mouse gestures, display the cursor, and operate the toolbar that summarizes each function.
・For details on each function, please refer to Graph function.