DncGraph displays the linked data via DncDaq and methods in a graph.
You can select overall display or additional display as the display method.
In addition, additional display, operation when the X-axis end is reached, initial display range setting, etc. are possible.
Initial display range specification
In DncGraph, the following display methods can be selected from "Graph drawing mode" on DncGraph Setting Screen.
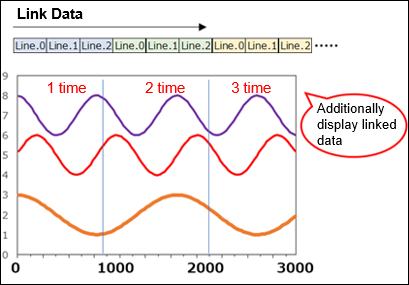
①Additional display mode
In the additional display mode, the data is drawn in the form of adding the linked data each time.
The behavior when the end of the X-axis is reached is based on the end processing settings.
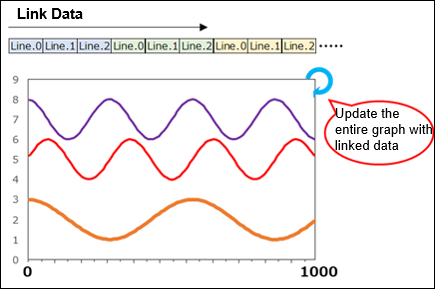
②Batch display mode
In overall display mode, the entire graph is updated using the linked data.
Please use it when you want to always display the same number of data.
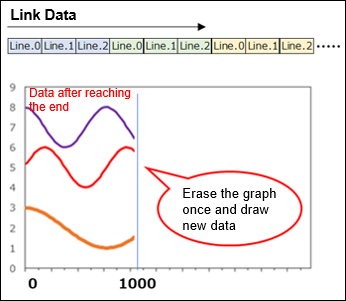
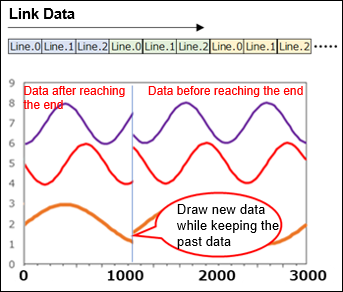
In the additional display mode, select the operation when the graph is drawn to the end of the X-axis.
The setting can be selected from "Graph end processing" on DncGraph Setting Screen.
①Refresh mode
In refresh mode, the graph is cleared and additional data is drawn when the end is reached.
②Overwrite mode
In overwrite mode, the graph is not cleared when the end is reached, and additional data is drawn.
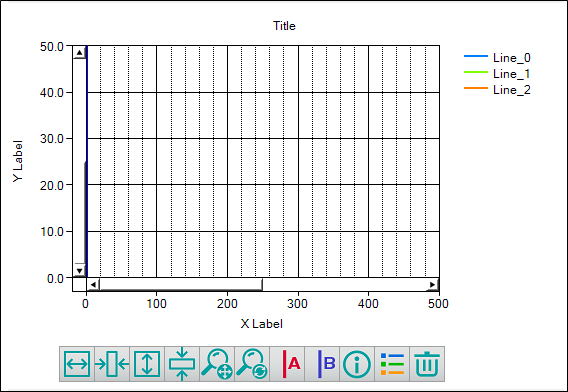
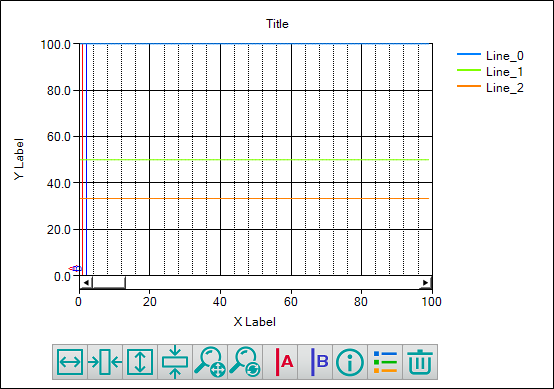
With DncGraph, it is possible to set the initial display range
when the application starts.
When this function is not used, the Y-axis range is displayed as the entire
range, and the X-axis range is displayed as 1/10 of the maximum range.
■Conditions
X-axis: 0-1000
Y-axis: 0-100
①When the initial display range is not specified
②Specify the initial display range below
X-axis: 0-500
Y-axis: 0-50