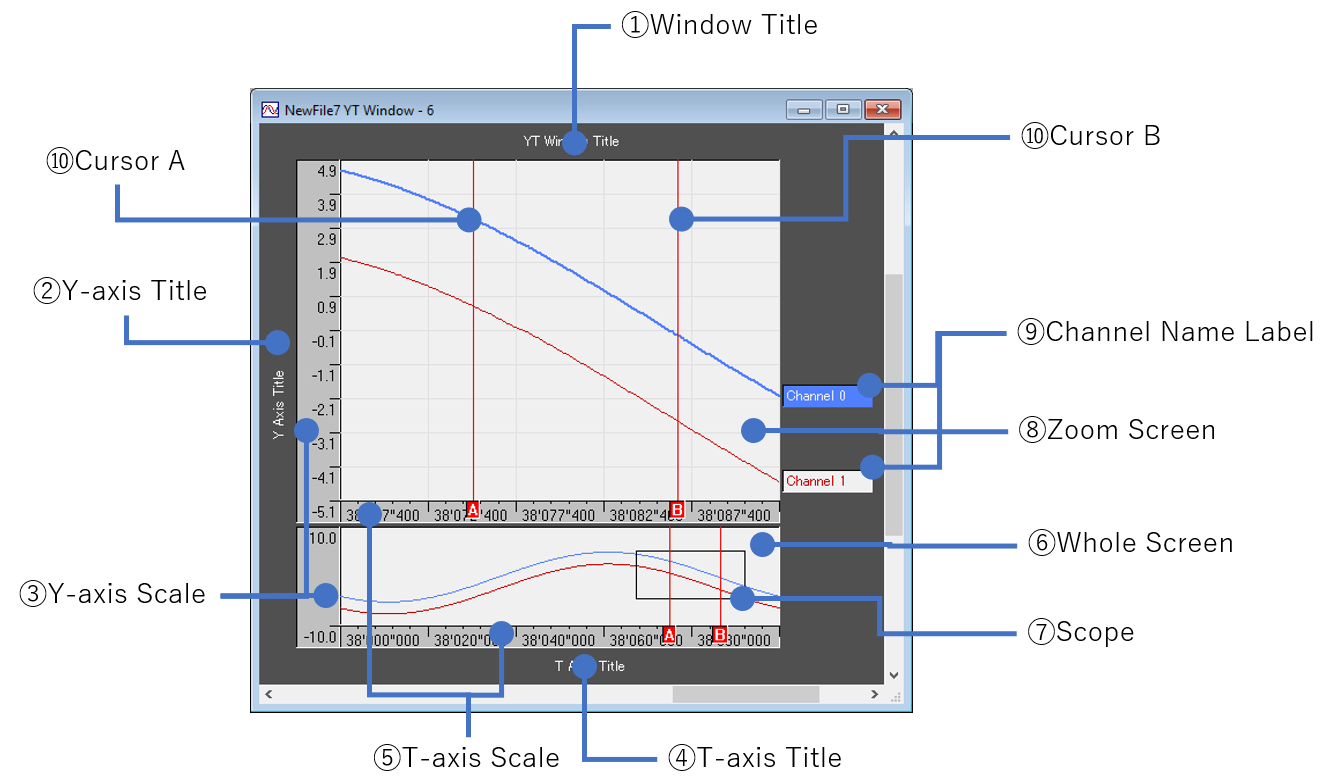
YT window is a 2-dimensional graph which displays time as horizontal axis and data as vertical axis.
Property |
Description |
①Window Title |
Title string of YT Window. |
②Y-axis Title |
Title string of Y-axis. |
③Y-axis Scale |
Displays the value changed by scale conversion. Or displays the voltage value if scale conversion is not used. |
④T-axis Title |
Title string of T-axis. |
⑤T-axis Scale |
Displays scale of time axis. |
⑥Whole Screen |
Displays all acquired data. |
⑦Scope |
Indicates the area of Zoom Screen. |
⑧Zoom Screen |
Displays the surrounded area by Scope. |
⑨Channel Name Label |
Label for displaying name of channel. With this label, the switch of Active and Inactive can be performed. |
⑩Cursor |
Cursor for analyzing data. |
A popup menu is shown on right-click in YT
Window.
In this menu, there are several commands relevant to YT Window.
Property |
Description |
T-axis zoom in |
Expands horizontal axis to twice. |
T-axis zoom out |
Reduces horizontal axis to one half. |
Y-axis zoom in |
Expands vertical axis to twice. |
Y-axis zoom out |
Reduces vertical axis to one half. |
T-axis adjustment |
Adjust the T-axis based on the display width and the number of data. |
Y-axis adjustment all channels |
Adjust the Y-axis. They cannot be used simultaneously in Y-axis. Adjust the Y-axis to show all graphs. |
Absolute Time |
Displays starting time as absolute time. |
Relative Time |
Displays starting time as 0. |
Cursor A |
Shows Cursor A or not. |
Cursor B |
Shows Cursor B or not. |
Cursor S |
Shows Cursor S or not. |
YT Auto Scroll |
Turns on/off auto-scroll function of Zoom Screen. |
Save Image (Entire) |
Saves the entire screen as an image. |
Save Image (YT Graph) |
Saves the selected YT graph as an image. |
YT Window |
Option Shows YT Window Option dialog. |
Save Option |
Saves contents of option. |
Reset Option |
Resets contents of option to default. |