YT Window
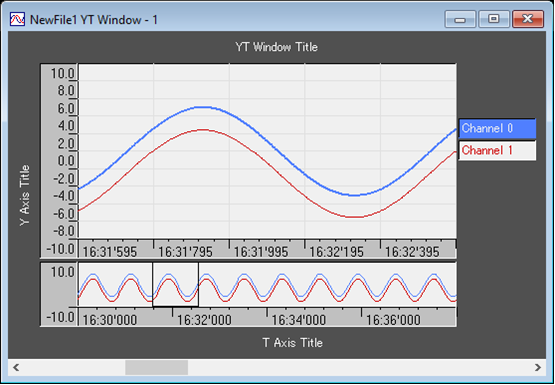
The graph of YT Window is split into 2 screens: Zoom Screen above and Whole Screen lower.
Whole Screen : All of acquired data are displayed.
Zoom Screen : The data of an area in Whole Screen are zoomed in and displayed.
In Whole Screen, a rectangle named Scope is displayed. The inside of
rectangle is the area that is displayed in Zoom Screen.
The horizontal axis (T axis) of the YT graph is time or number of times,
and the vertical axis (Y axis) is data such as voltage.

YT Window
Select [View]-[YT Zoom]-[T-axis zoom in] or [Y-axis zoom in] to expand
T-axis or Y-axis.
And [T-axis zoom out] or [Y-axis zoom out] to reduce them.
While the mouse is moved onto Scope of Whole Screen, the mouse cursor
changes to cross mark.
At this time, the location of Scope can be moved by mouse dragging.