In the graph window, you can check the selected output waveform graphically.
The output waveform is the display for one waveform.
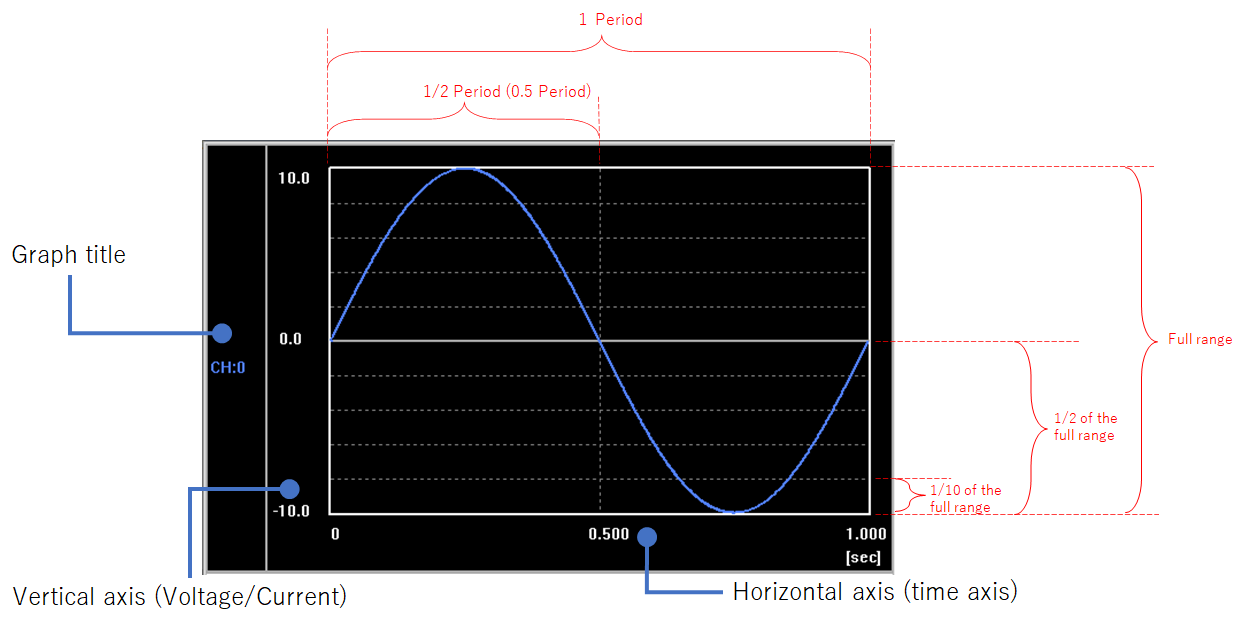
The following is a display example when a sine wave of 1Hz, phase of 0 degrees, and output range of [-10V to +10V] are specified for ch0.
The horizontal axis is the time axis, in seconds.
A solid white line is displayed with one period of the waveform as the maximum value.
As an auxiliary line, the 0.5 cycle part (center) is indicated by a gray dashed line.
The vertical axis changes depending on the selected device.
If a device that outputs a voltage value[V] is selected, it will be [-10V to +10V].
If a device that outputs a current value[A] is selected, it will be [0 to 20mA].
The maximum and minimum values are indicated by solid white lines.
As an auxiliary line, a solid gray line is displayed in the half of the full range (= maximum value - minimum value) (center).
Also, gray dash-dotted lines are shown at 1/10 intervals of the full range.
The graph title shows the channel No. that outputs the waveform.
The channel text color and graph display color are displayed in the same color.
When outputting waveforms from multiple channels from the same device, you can check the output waveforms for each channel by the graph display color and channel text color.