Here, explain the screen of DncGraph.
Toolbar operations and cursor information display are enabled during execution, not in designer mode.
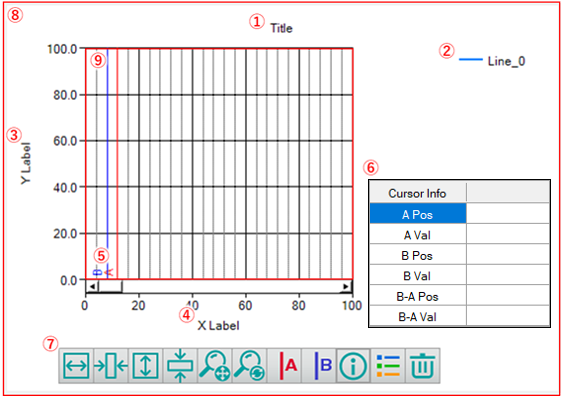
①Graph title
Shows the title of the graph.
Graph title text and display enable/disable can be set from the Property.
②Graph legend
Shows the legend of the graph.
You can enable or disable the legend by Property, Toolbar operation.
③Y-axis label
Displays the descriptive text for the Y-axis label.
Label text and display enable/disable can be set from the Property.
④X-axis label
Displays the descriptive text for the X-axis label.
Label text and display enable/disable can be set from the Property.
⑤Graph cursor
Displays a cursor to retrieve the data for the selected line.
Two types of cursors, A cursor and B cursor, can be displayed, and the difference between the B cursor value and the A cursor value can be obtained.
You can enable or disable the cursor by operating Property setting panel, Property, Toolbar operation.
Displays information about the point where the cursor intersects the selected line.
If no line is selected, the data with the smallest line No. is displayed.
Line can be selected by clicking the line on the graph.
The selected line will be displayed brightly.
You can show or hide the cursor information by Property setting panel, Property, Toolbar operation.
⑦Toolbar
Buttons for zooming and displaying/hiding graph items.
For the contents that can be operated on the toolbar, please refer to Toolbar function.
You can enable or disable the toolbar by using Property setting panel, Property.
This area shows the entire graph.
The contents set in GraphArea property are reflected in this area.
This area shows the part where the data is displayed.
The contents set in PlotArea Collection property are reflected for this area.