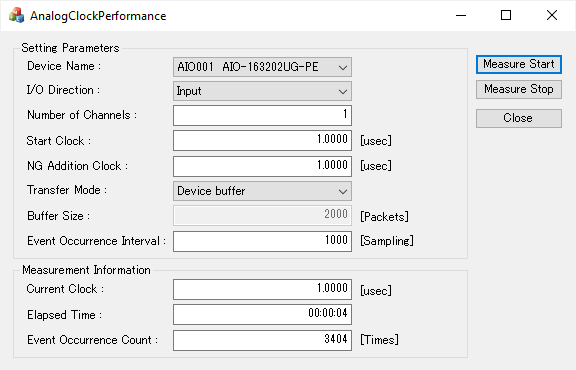
Analog Clock Performance can measure the clock speed at witch it can
operate continuously.
The period during which the clock speed specified in advanced is strictly
adhered to is displayed in the elapsed time.
If you want to know the execution speed of each function, please use Program for Measuring the Executive Speed of Function.

1. Enter or select the specified value for the item in the setting parameters.
2. Press the "Measure Start " button to start measurement according to the set parameters.
3. Press the "Measure Stop" button to stop measurement.
4. Press the “Close” button to exit Analog Clock Performance.
Overview |
Folder name |
\CONTEC\API-TOOL\AIOWDM\Utility\ |
Program name |
AnalogClockPerformance.exe |
|
Setting Parameters |
Device Name |
Select device to measure. You can select device registered in Device Manager. |
I/O Direction |
Select "Input" or "Output". With "Input", you can test for Analog Input function. With "Output", you can test for Analog Output function. |
|
Number of Channels |
Any integer number more than 1(one). You can enter up to the maximum number of channels for the specified device. If the value exceeds the maximum number of channels, an error will occur during measurement. |
|
Start Clock |
Any floating point number. Specify the clock in micro sec. If the value exceeds the maximum clock, an error will occur during measurement. |
|
NG Addition Clock |
Any floating point number. Specify the value to be added to the starting clock when a sampling clock error or overflow error occurs. |
|
Transfer Mode |
Select "Device buffer" or "User buffer". |
|
Buffer Size |
Any integer number more than 1(one). It displays greyed-out and ignores when you select "Device buffer". This can be specified only when you select "User buffer". |
|
Event Occurrence Interval |
Any integer number more than 1(one). Please specify it in units of [Sampling]/[Generating] when you select "Device buffer". Please specify it in units of [Transfer Times] when you select "User buffer". |
|
Measurement Information |
Current Clock |
(Cannot be specified) At the start of measurement, the "Start Clock" is displayed. If a conversion error occurs, the current clock that reflects the "NG Addition Clock" is displayed. |
Elapsed Time |
(Cannot be specified) The elapsed time from the start of measurement is displayed. If a conversion error occurs, the elapsed time reverts to 00:00:00. |
|
Event Occurrence Count |
(Cannot be specified) Displays the number of events that have occurred since the start of measurement. |
Measured value for your reference.
The measured values in the table below
are not guaranteed by CONTEC.
These are merely for your reference data.
The measured values will depend on the PC and OS configuration.
Model No. |
I/O Direction |
Number of channels on device |
Number of channels for measuring |
Measured Value |
AI-1204Z-PE |
Input |
4ch |
1ch |
0.10 [microseconds] |
AIO-163202UG-PE |
Input |
32ch |
1ch |
1.00 [microseconds] |
AIO-163202UG-PE |
Output |
2ch |
1ch |
10.0 [microseconds] |
AI-1608VIN-USB |
Input |
8ch |
1ch |
10.0 [microseconds] |
AO-1604VIN-USB |
Output |
4ch |
1ch |
10.0 [microseconds] |
The environments on measure:
PC: CPU 12th Gen Intel(R) Core(TM) i5-12400
2.50 GHz, Chipset Intel(R) B660, Memory Size: 16.0 GB (15.8 GB available)
OS: Windows 11 Professional (23H2) 64bit
The judgment criteria:
Event Occurrence Interval: Shorter than 100
milliseconds.
Elapsed Time: Continuously more than 1 hour.
測定環境:
PC: CPU 12th Gen Intel(R) Core(TM) i5-12400
2.50 GHz, Chipset Intel(R) B660, Memory Size: 16.0 GB (15.8
GB 使用可能)
OS: Windows 11 Professional (23H2) 64bit
判定基準:
イベント発生間隔:100msec以下
経過時間:1時間以上